
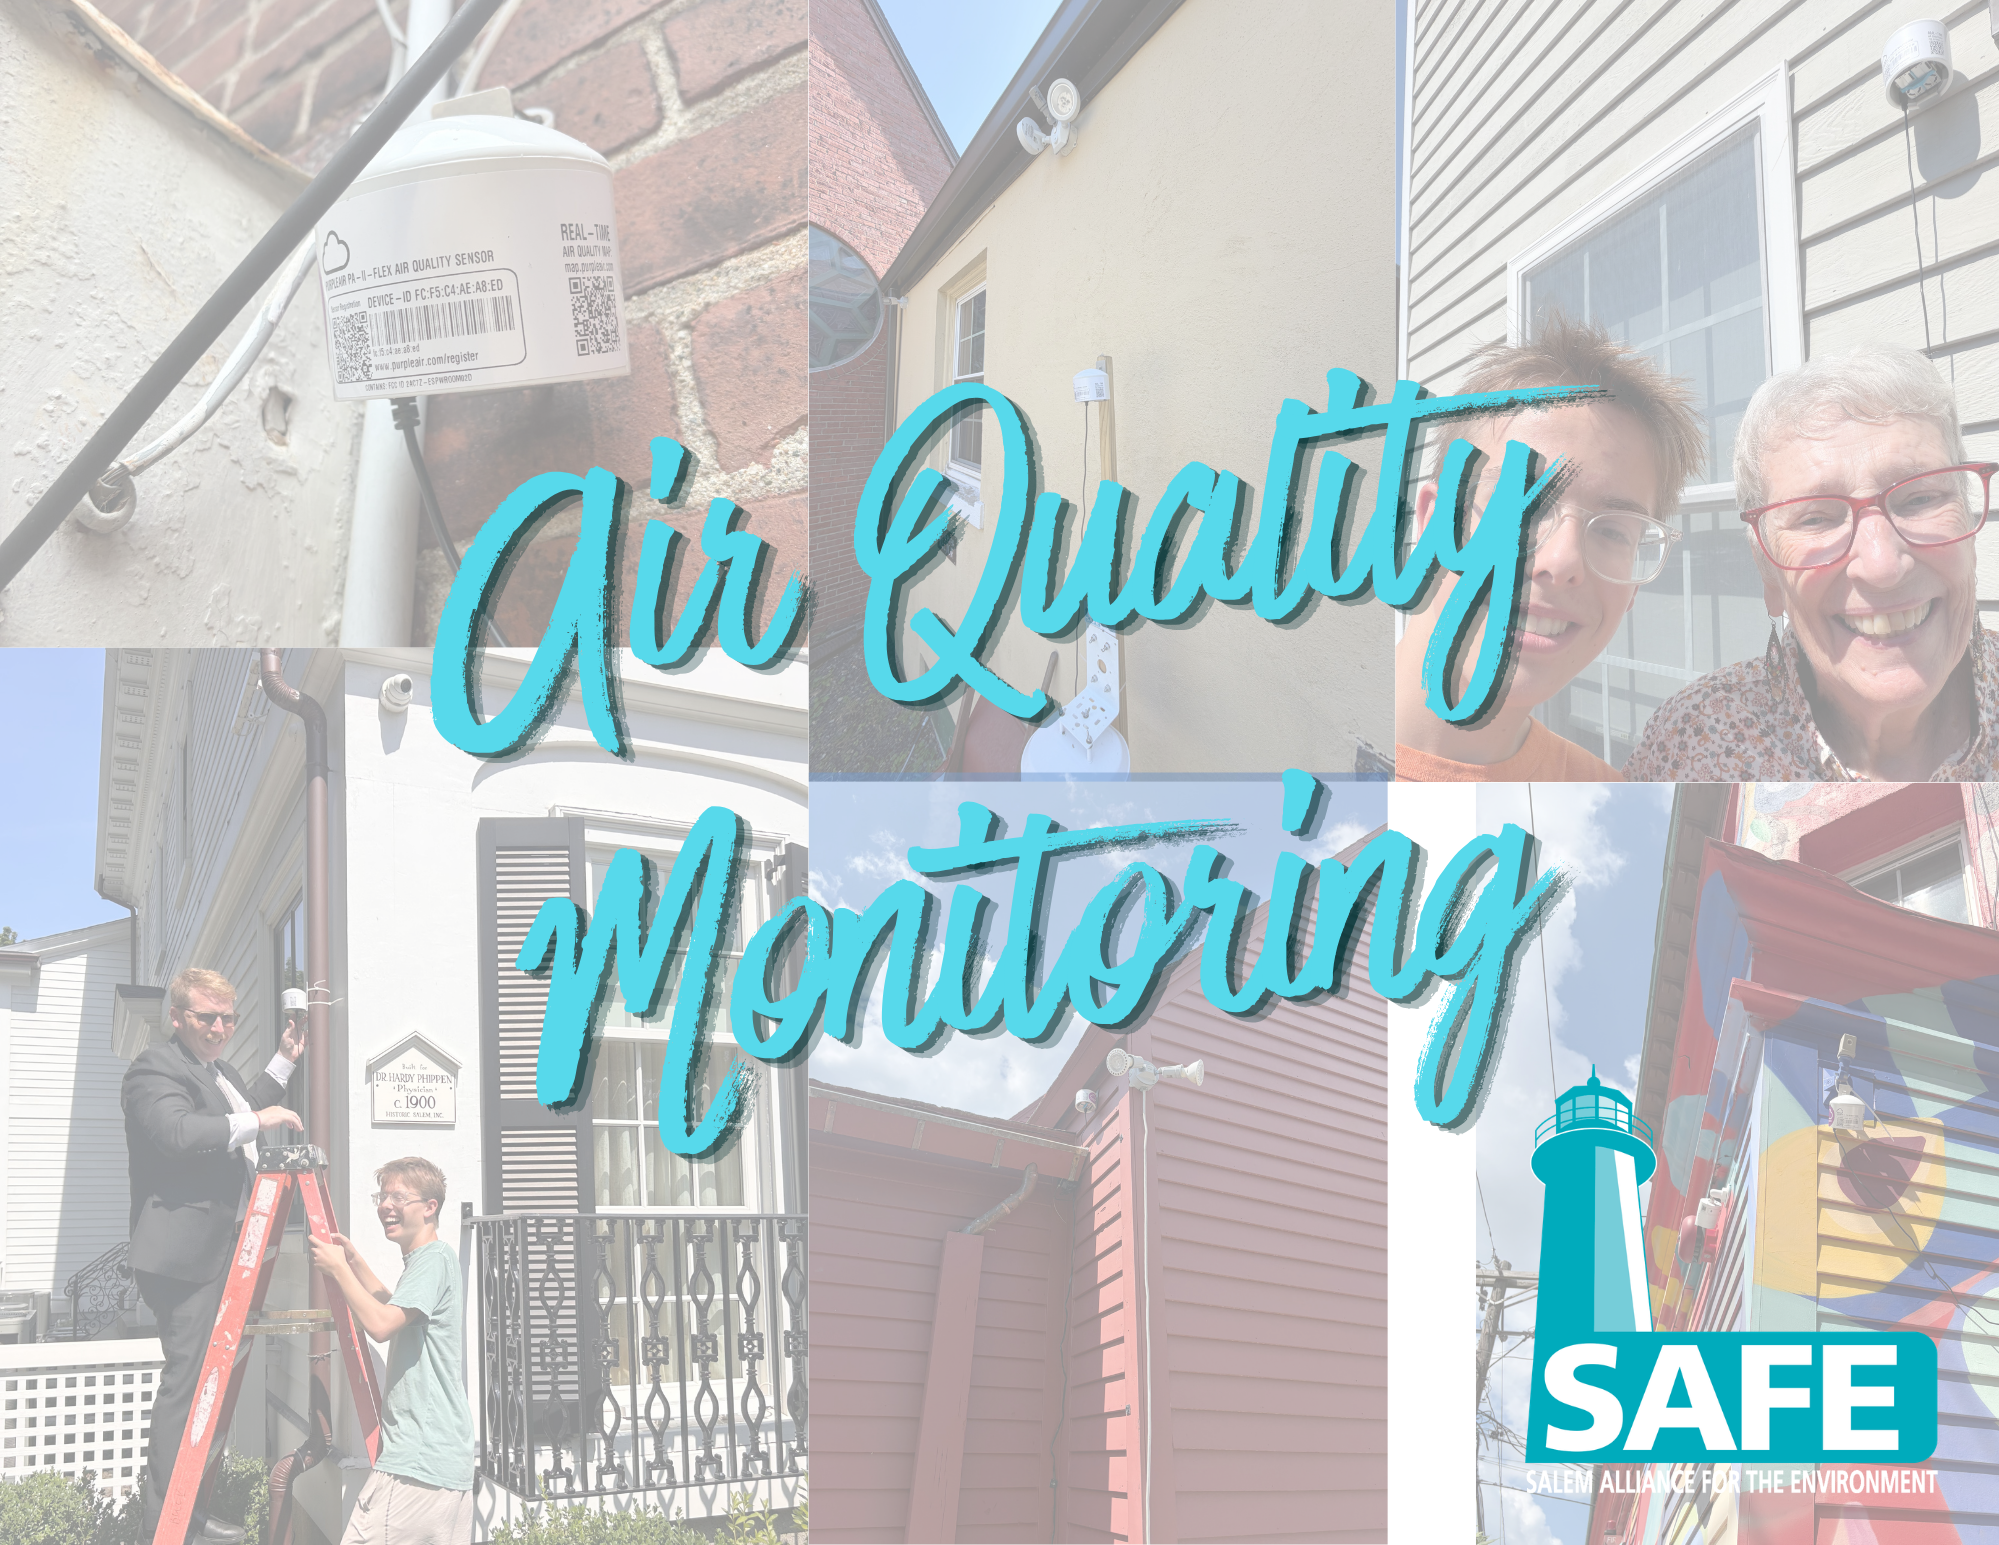
Just last month, Salem’s skies were overtaken with an apocalyptic orange hue. Canadian wildfires raged, causing smoke to billow into our communities. While many of us felt a burning sensation in our throat, wildfire smoke causes vulnerable groups to experience elevated rates of asthma, heart attack, stroke, and pregnancy complications.
A Stanford study published in the Nature journal predicts that 71,420 excess deaths per year by 2050 will occur as a result of wildfire smoke under a high-warming scenario. This means that as wildfires grow in frequency and severity due to climate change, it is increasingly important to monitor air quality in our communities. Additionally, as a host to a fossil fuel peaker plant, many visitors, and active development, Salem is prone to more air quality issues daily than most cities.
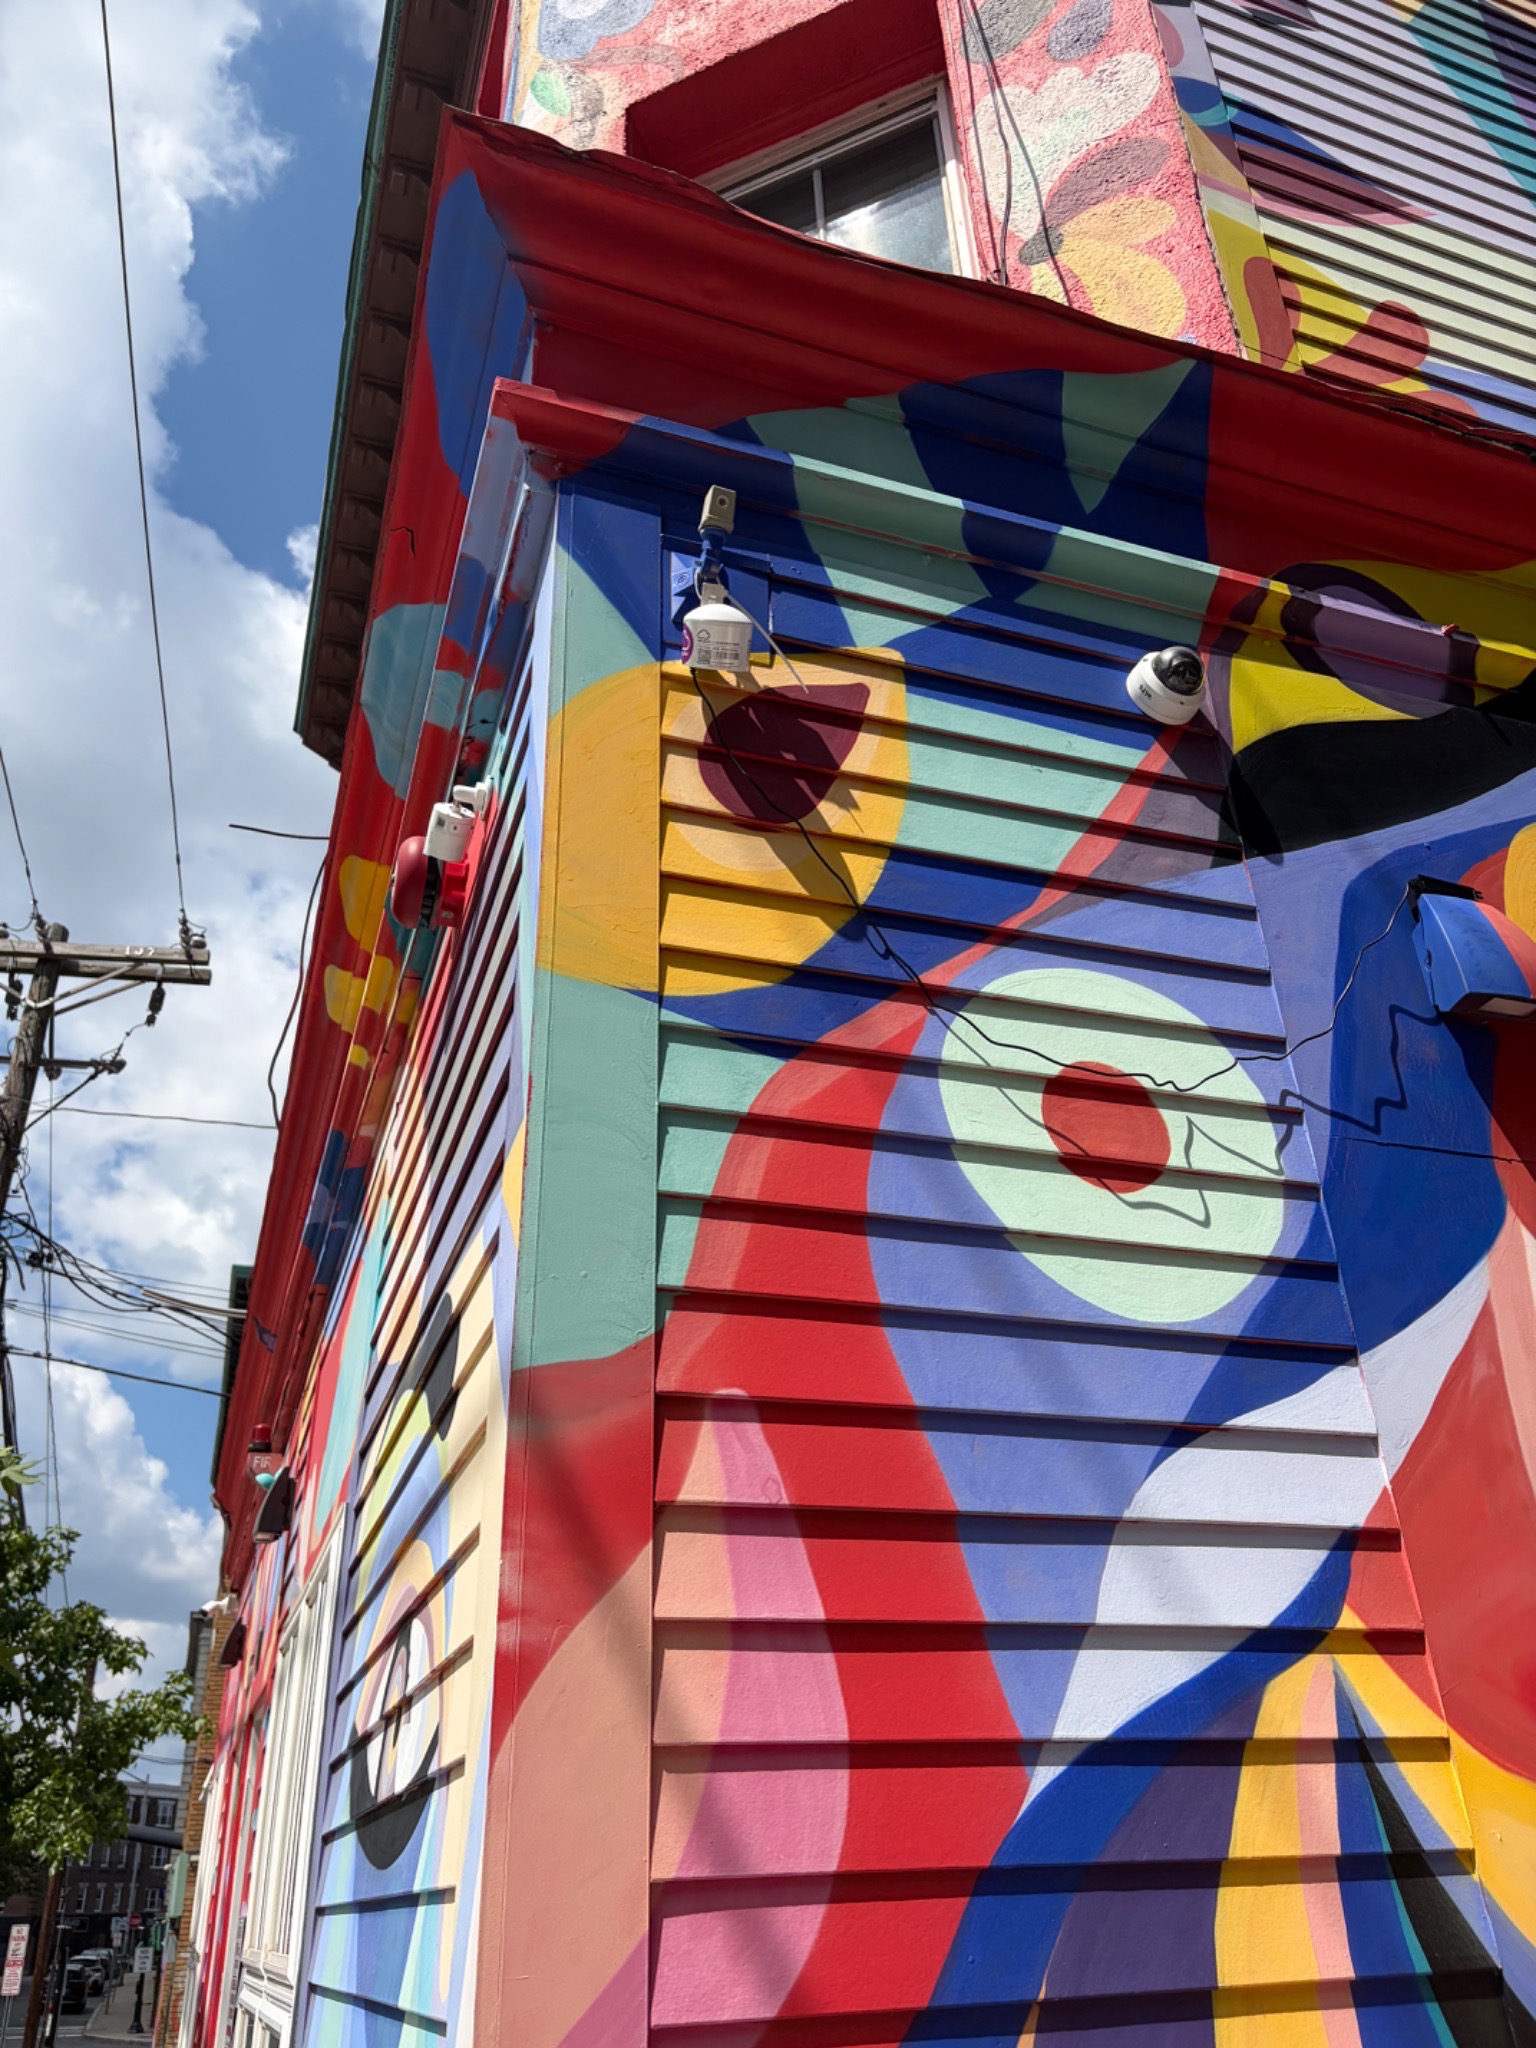
Over the summer , SAFE has been working with the NSCDC to install 10 air quality monitors throughout Salem, thanks to a grant from the Massachusetts Department of Environmental Protection. We chose to place our sensors in neighborhoods near the Salem Peaker Plant and in our most densely populated Environmental Justice neighborhood, El Punto. Now, including the 5 air quality monitors Salem Public Schools installed using the same grant, Salem has a total of 19 Purple Air Quality monitors installed.
Monitors in El Punto/The Point
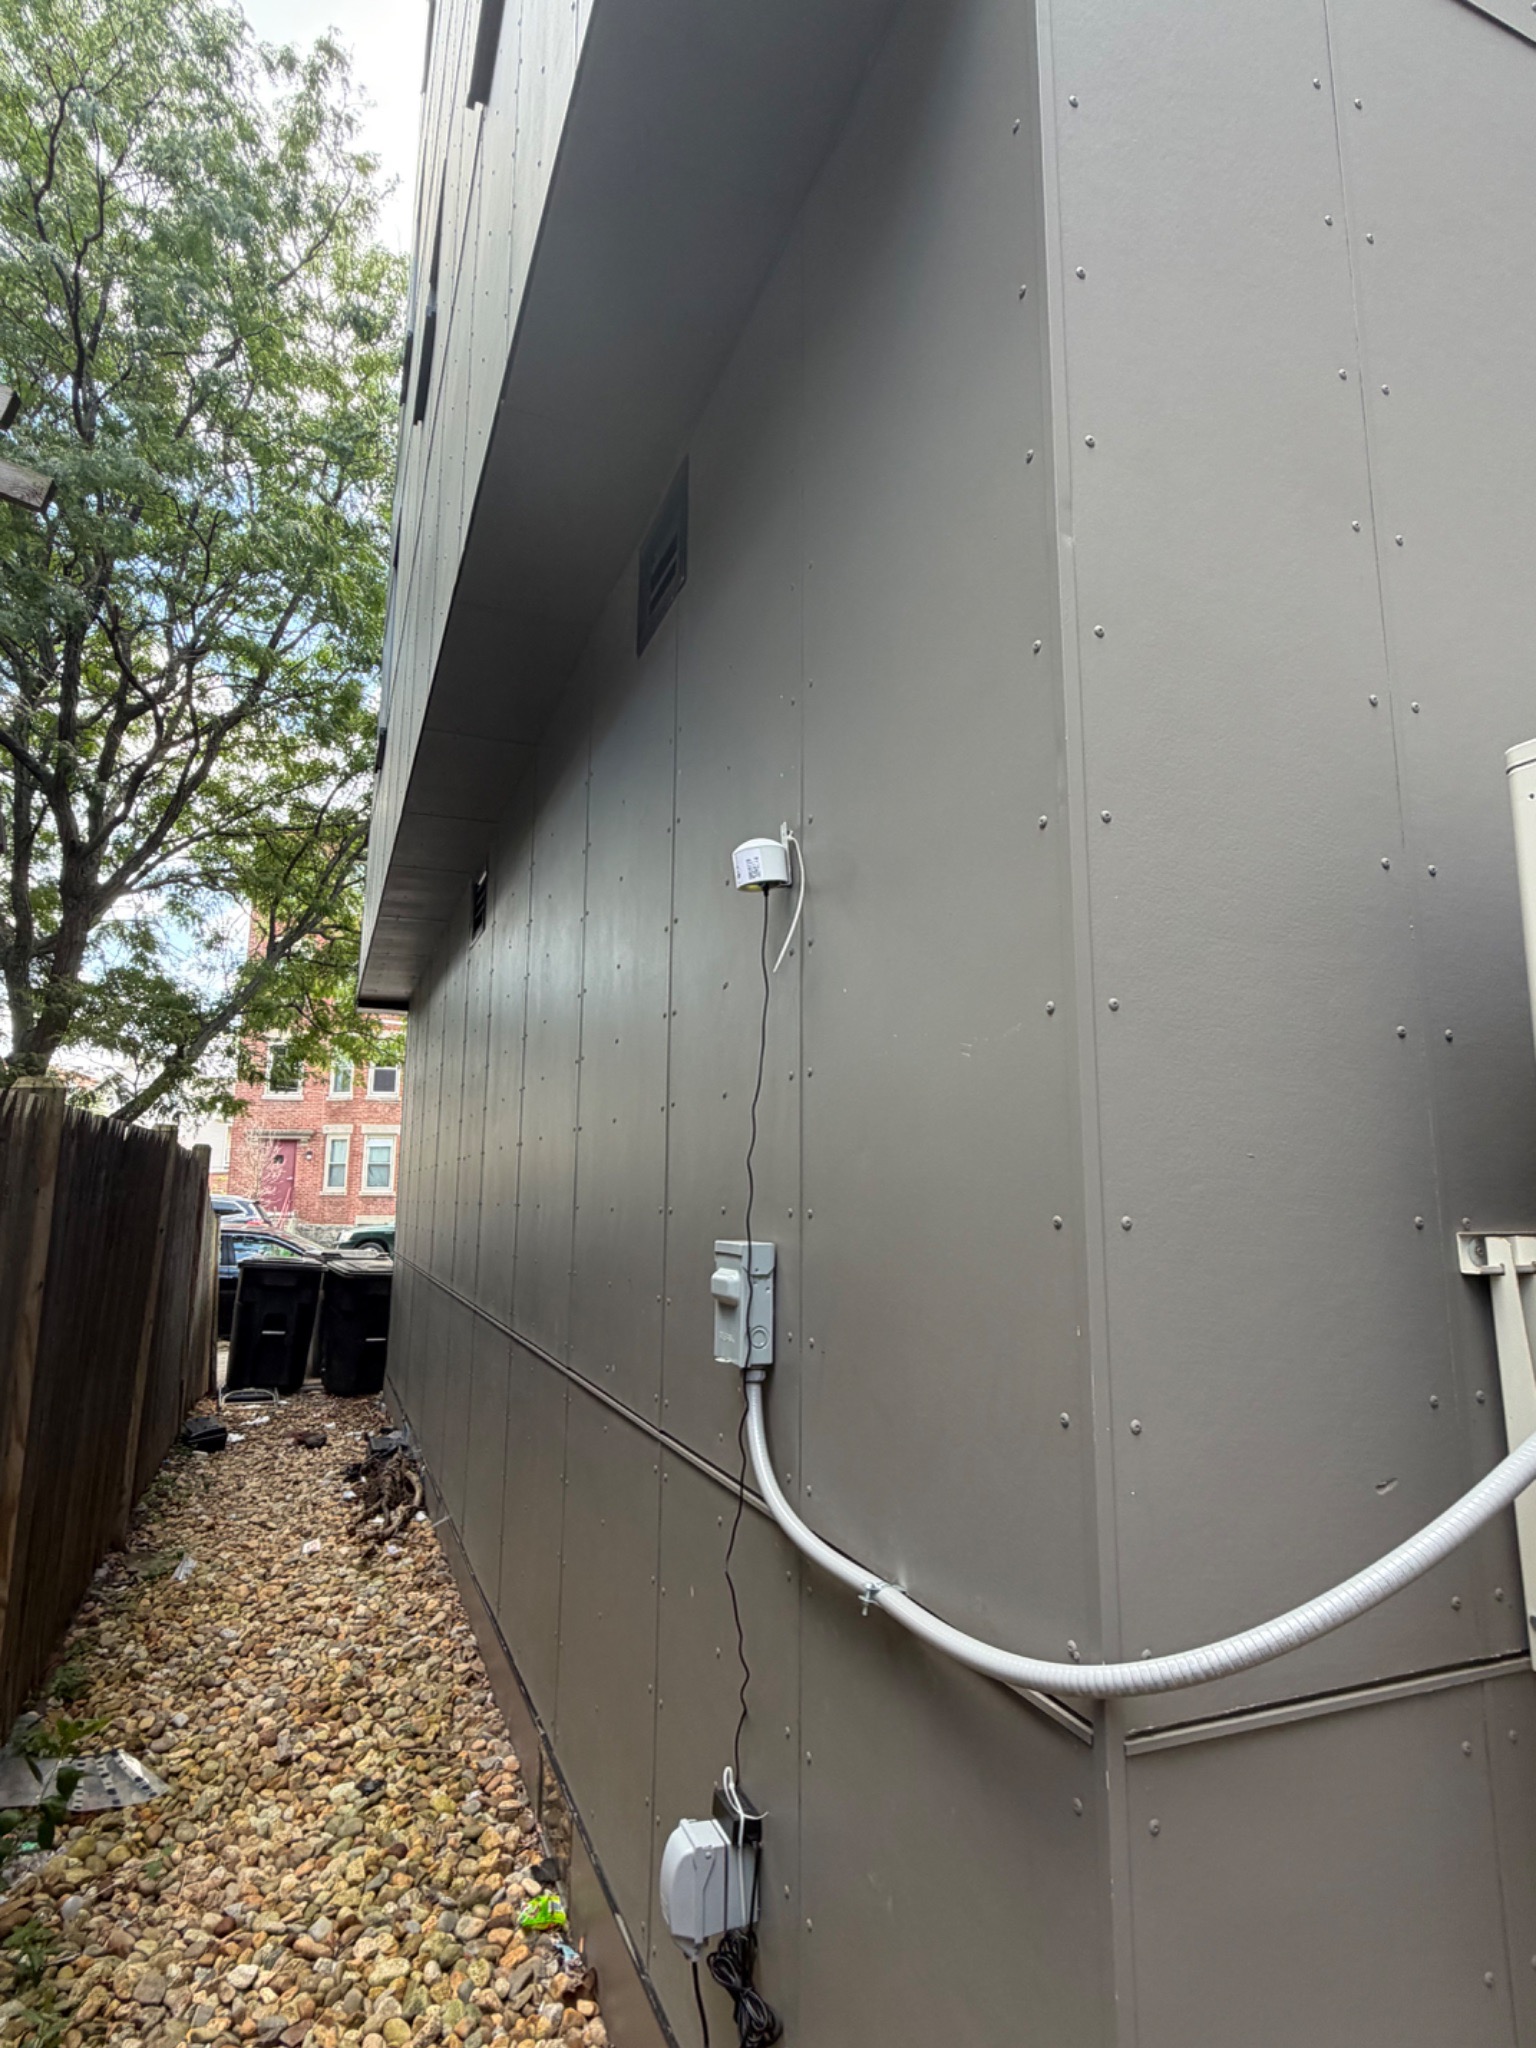
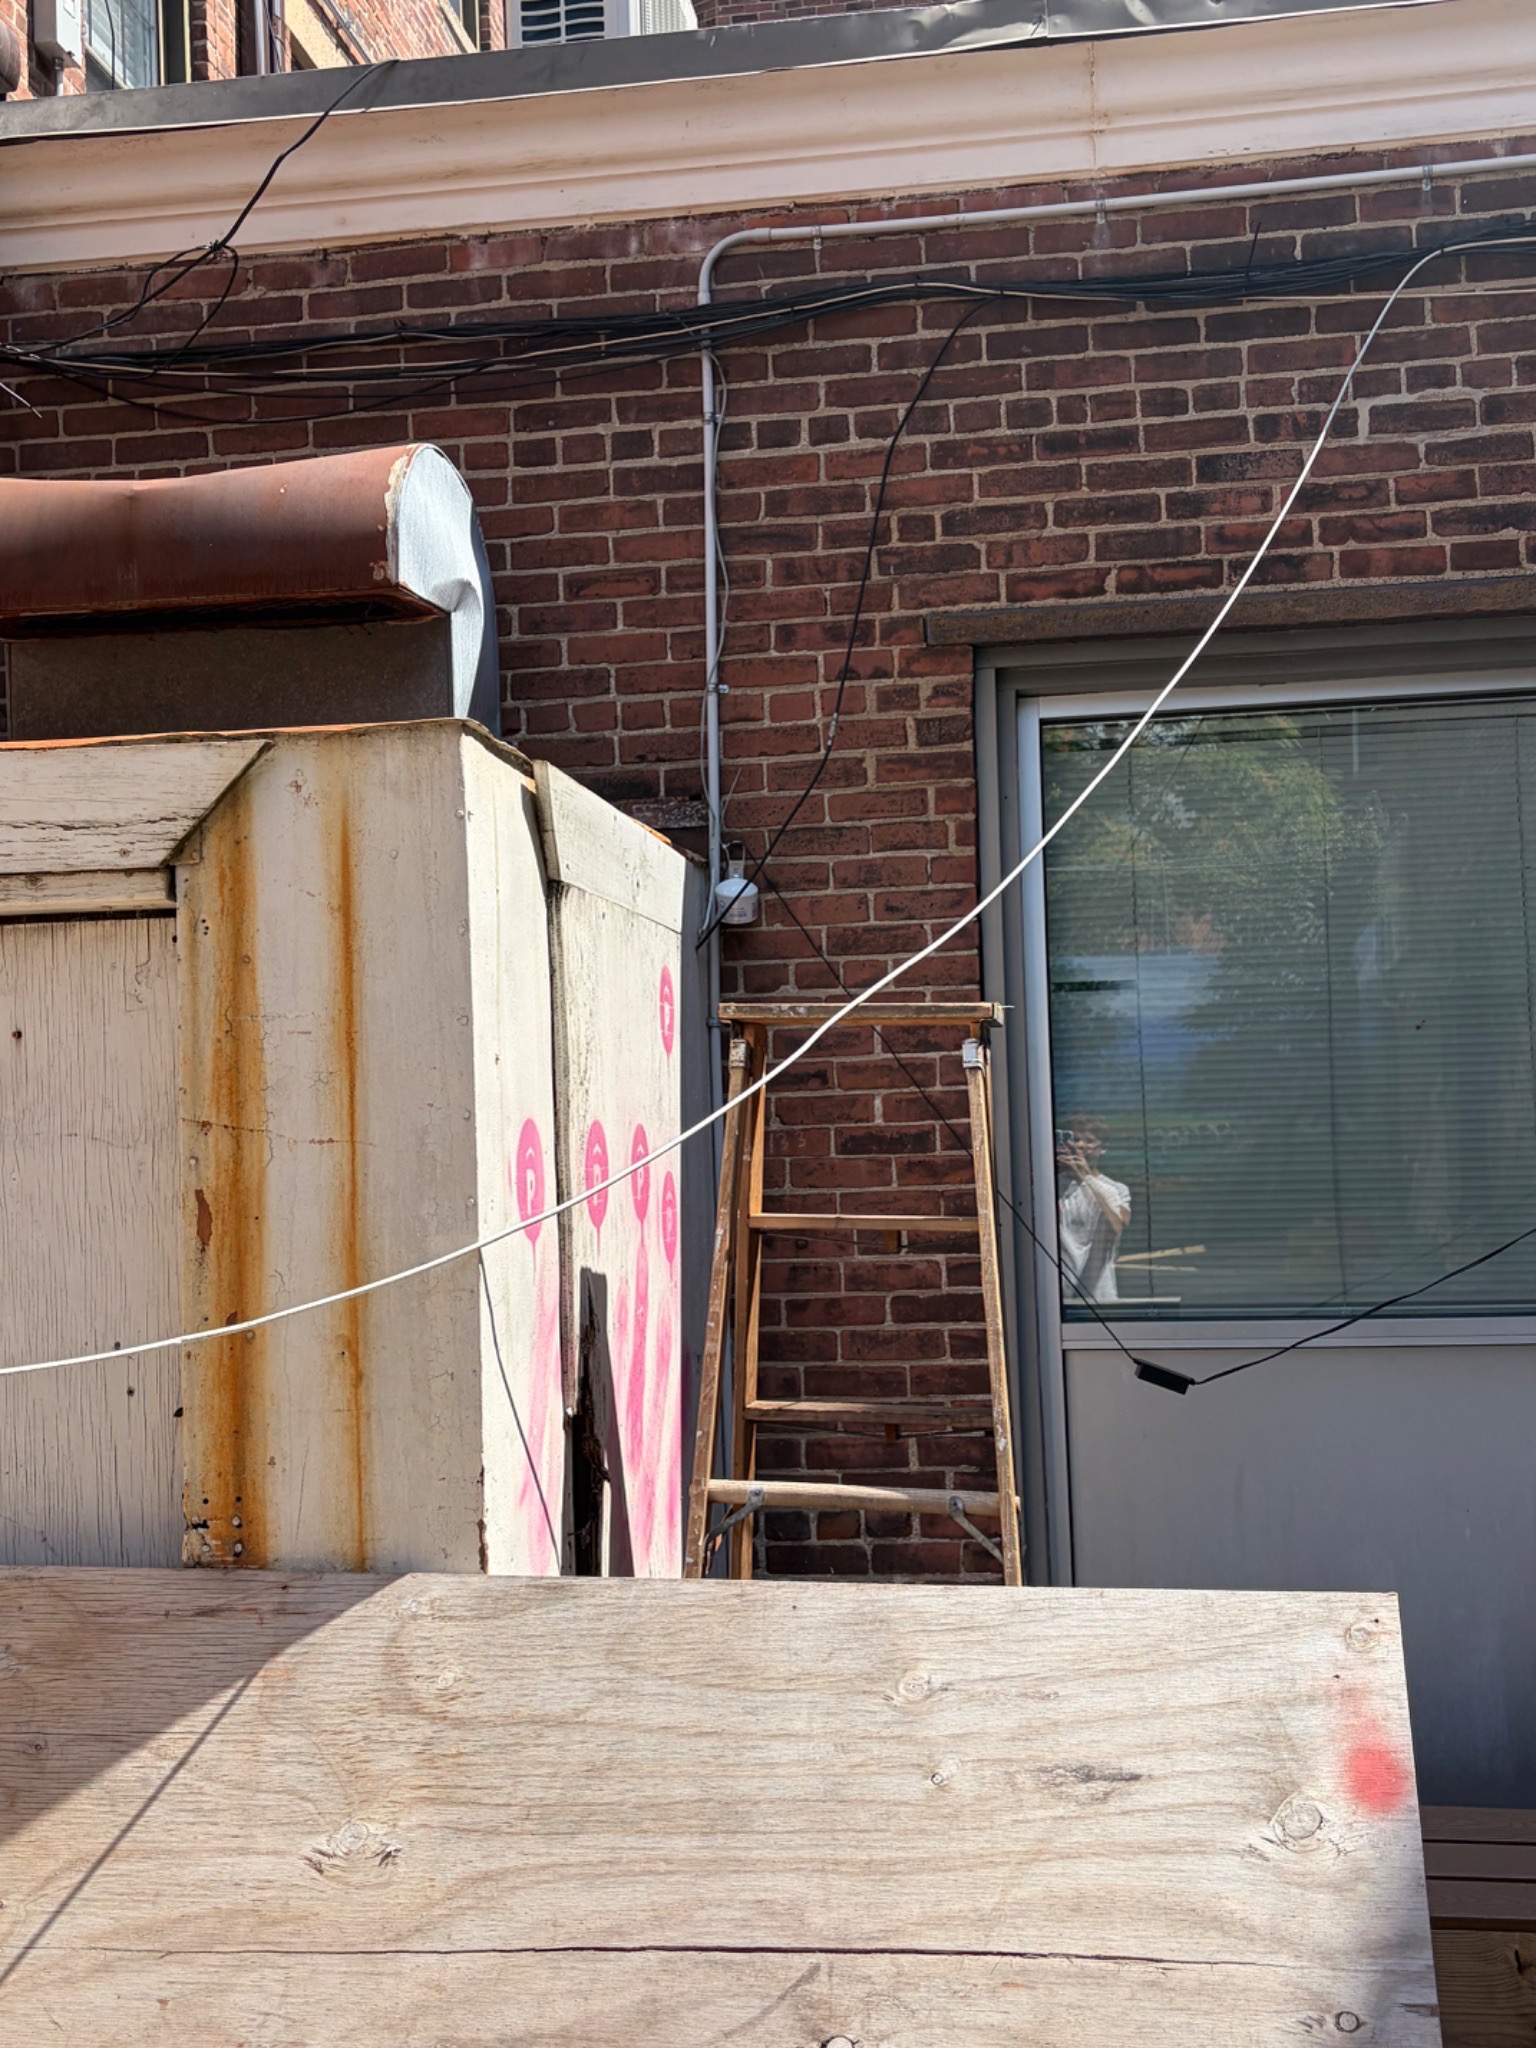
Monitors in the Port Area
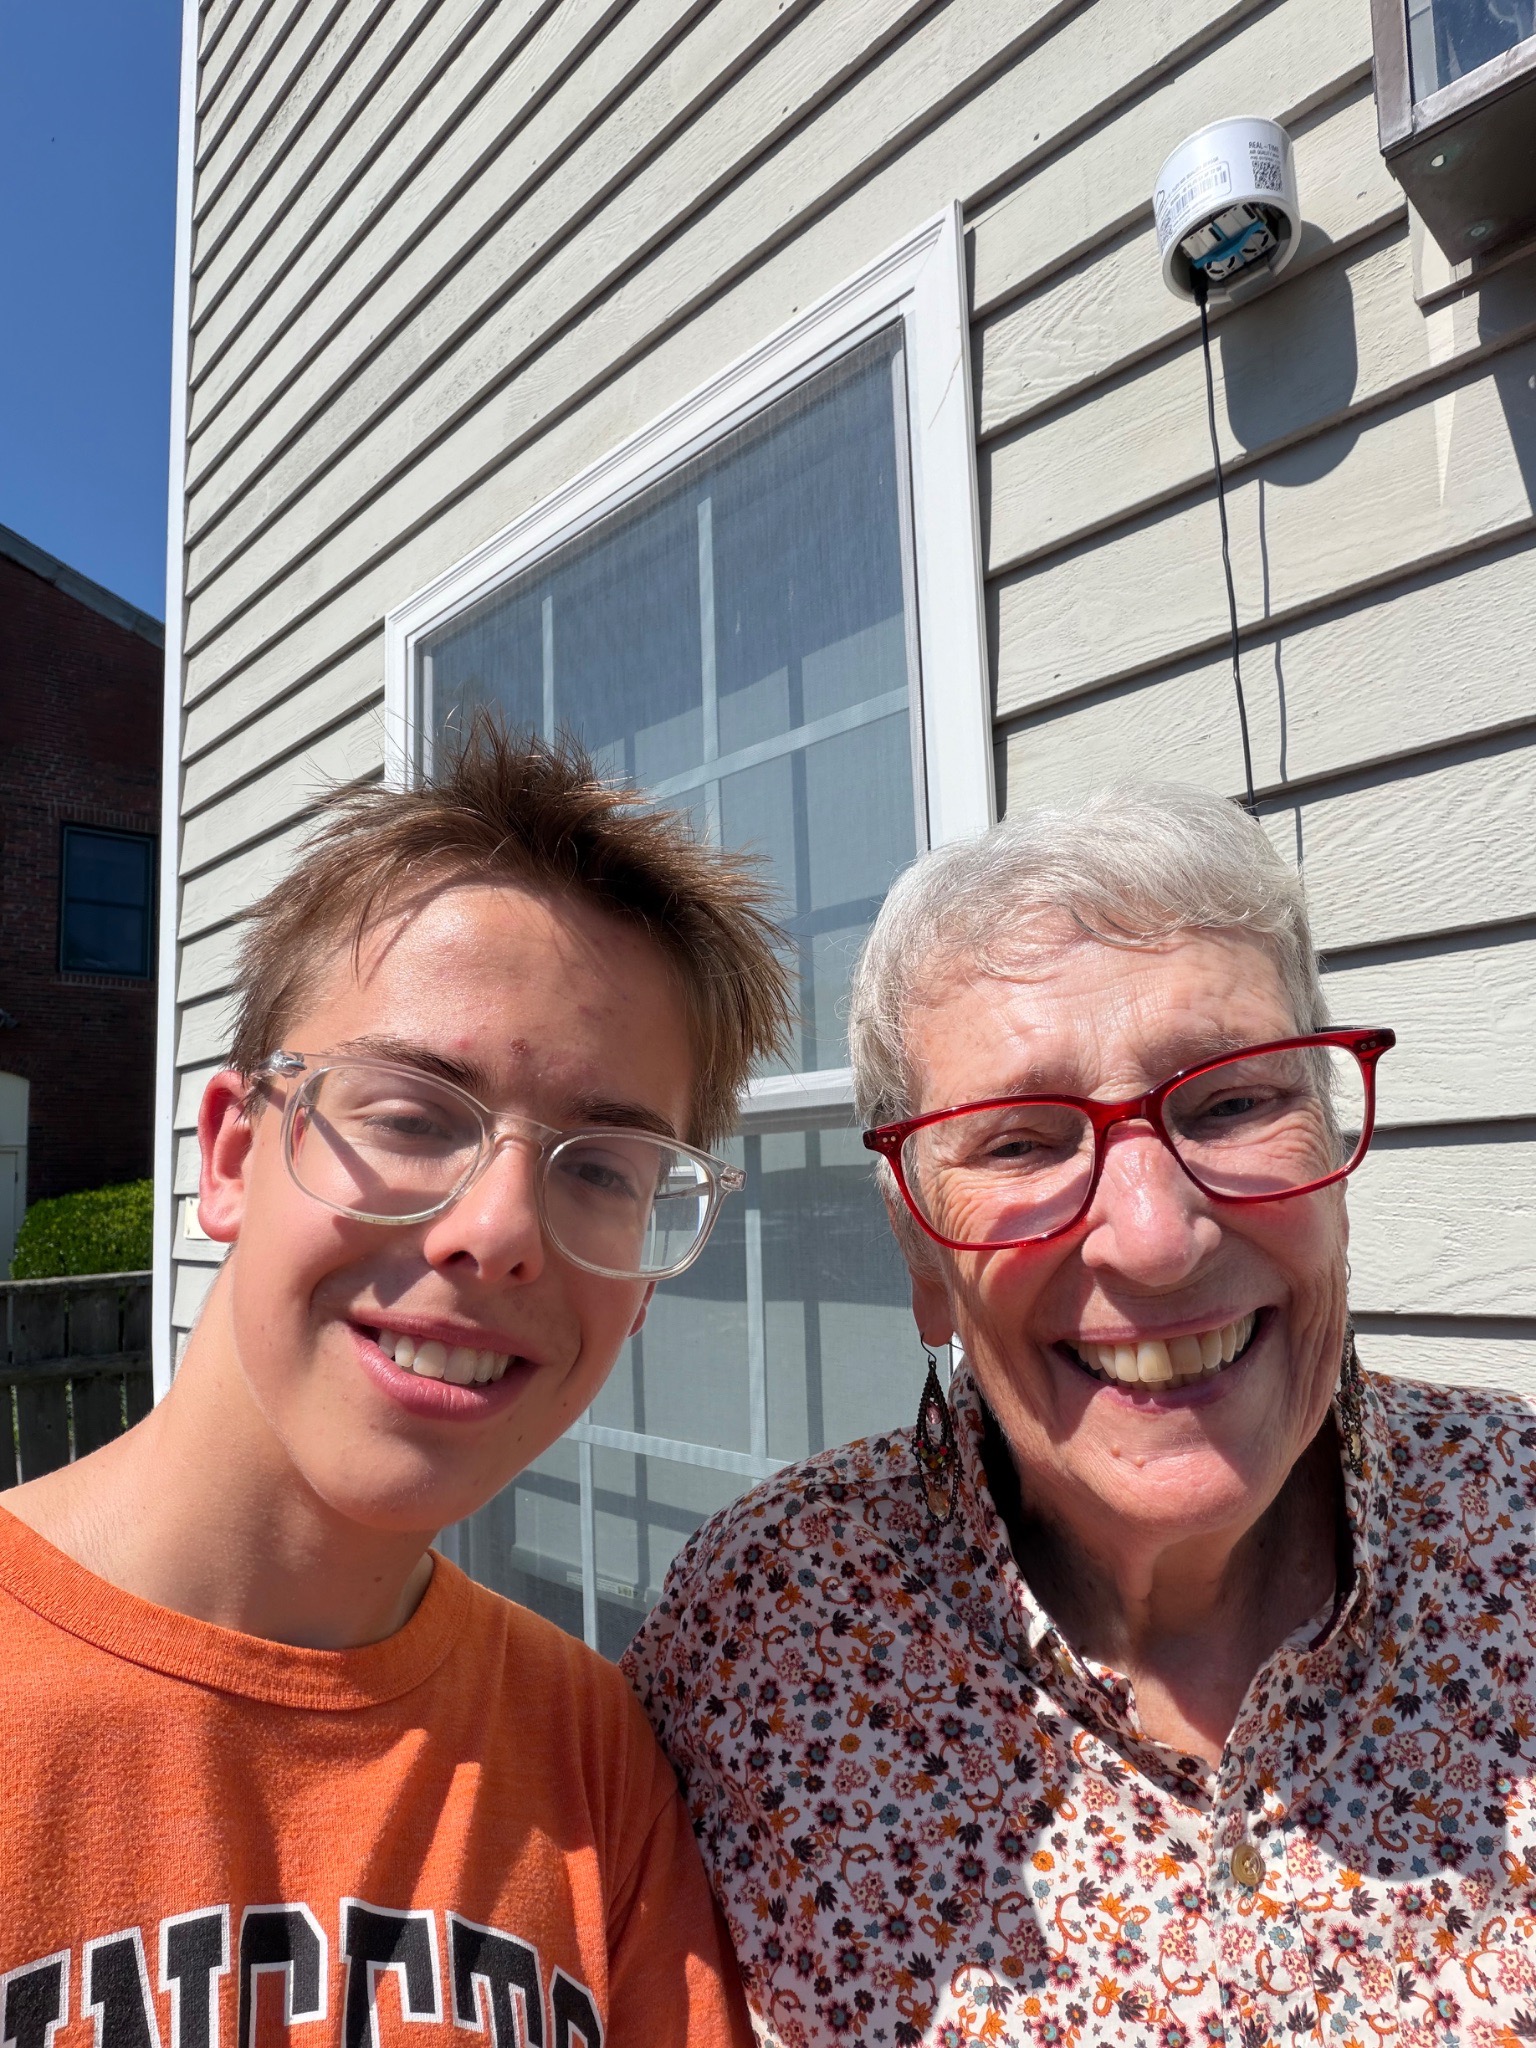

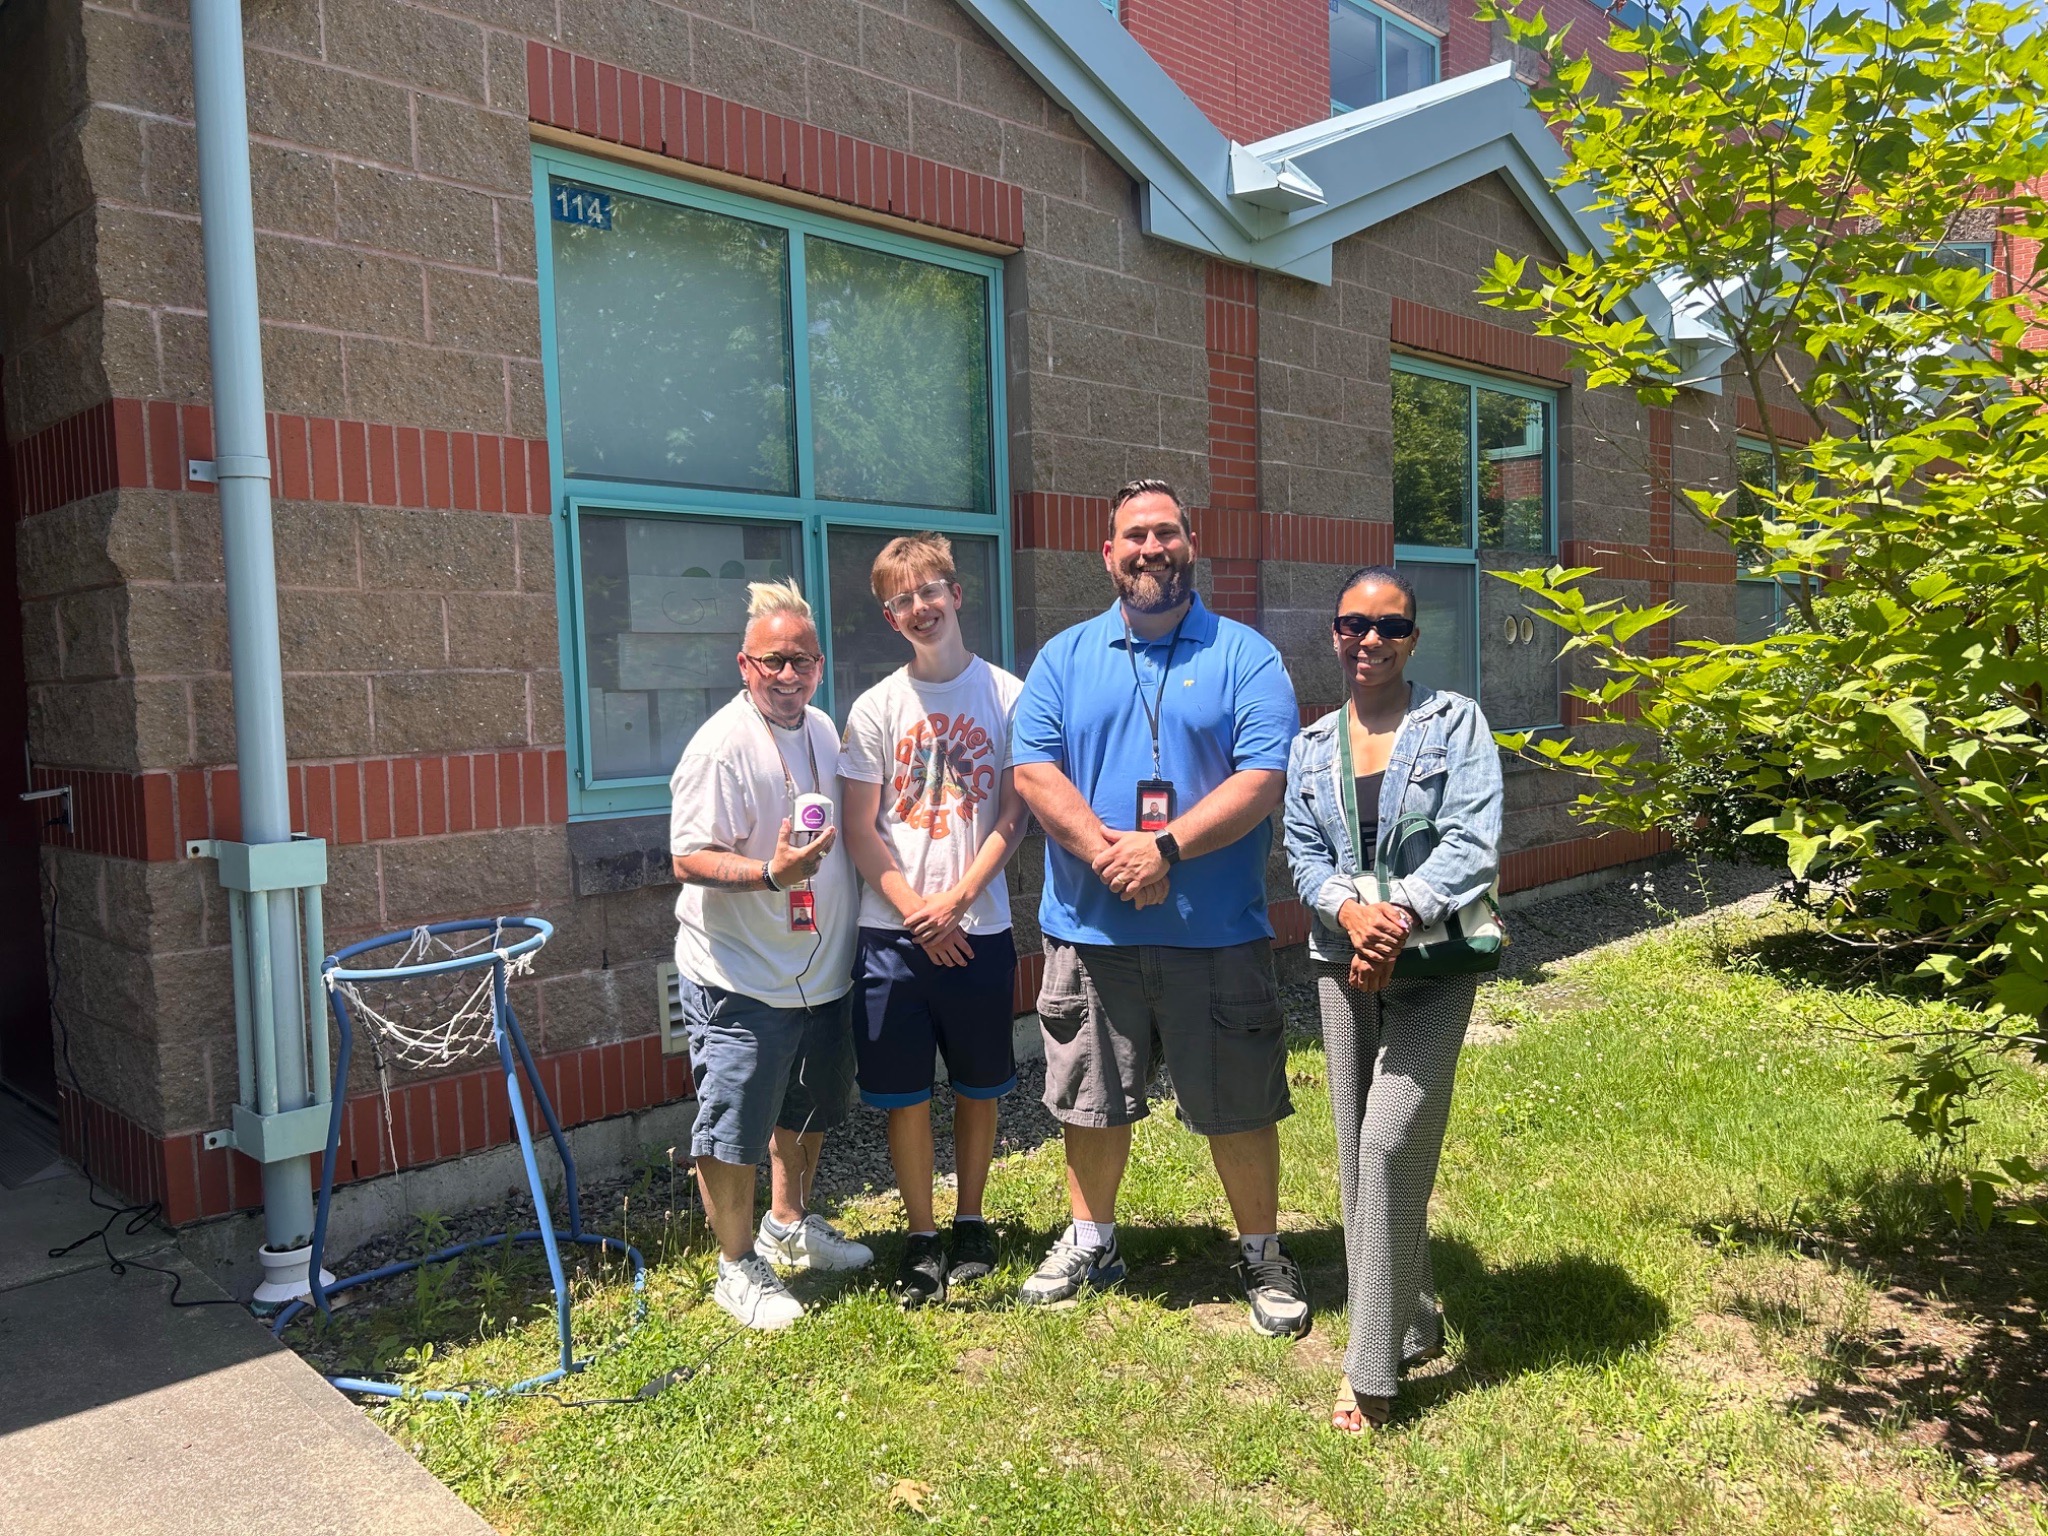
Monitors in Nearby Neighborhoods
Soon to Come: Carlton School Building – 10 Skerry Street
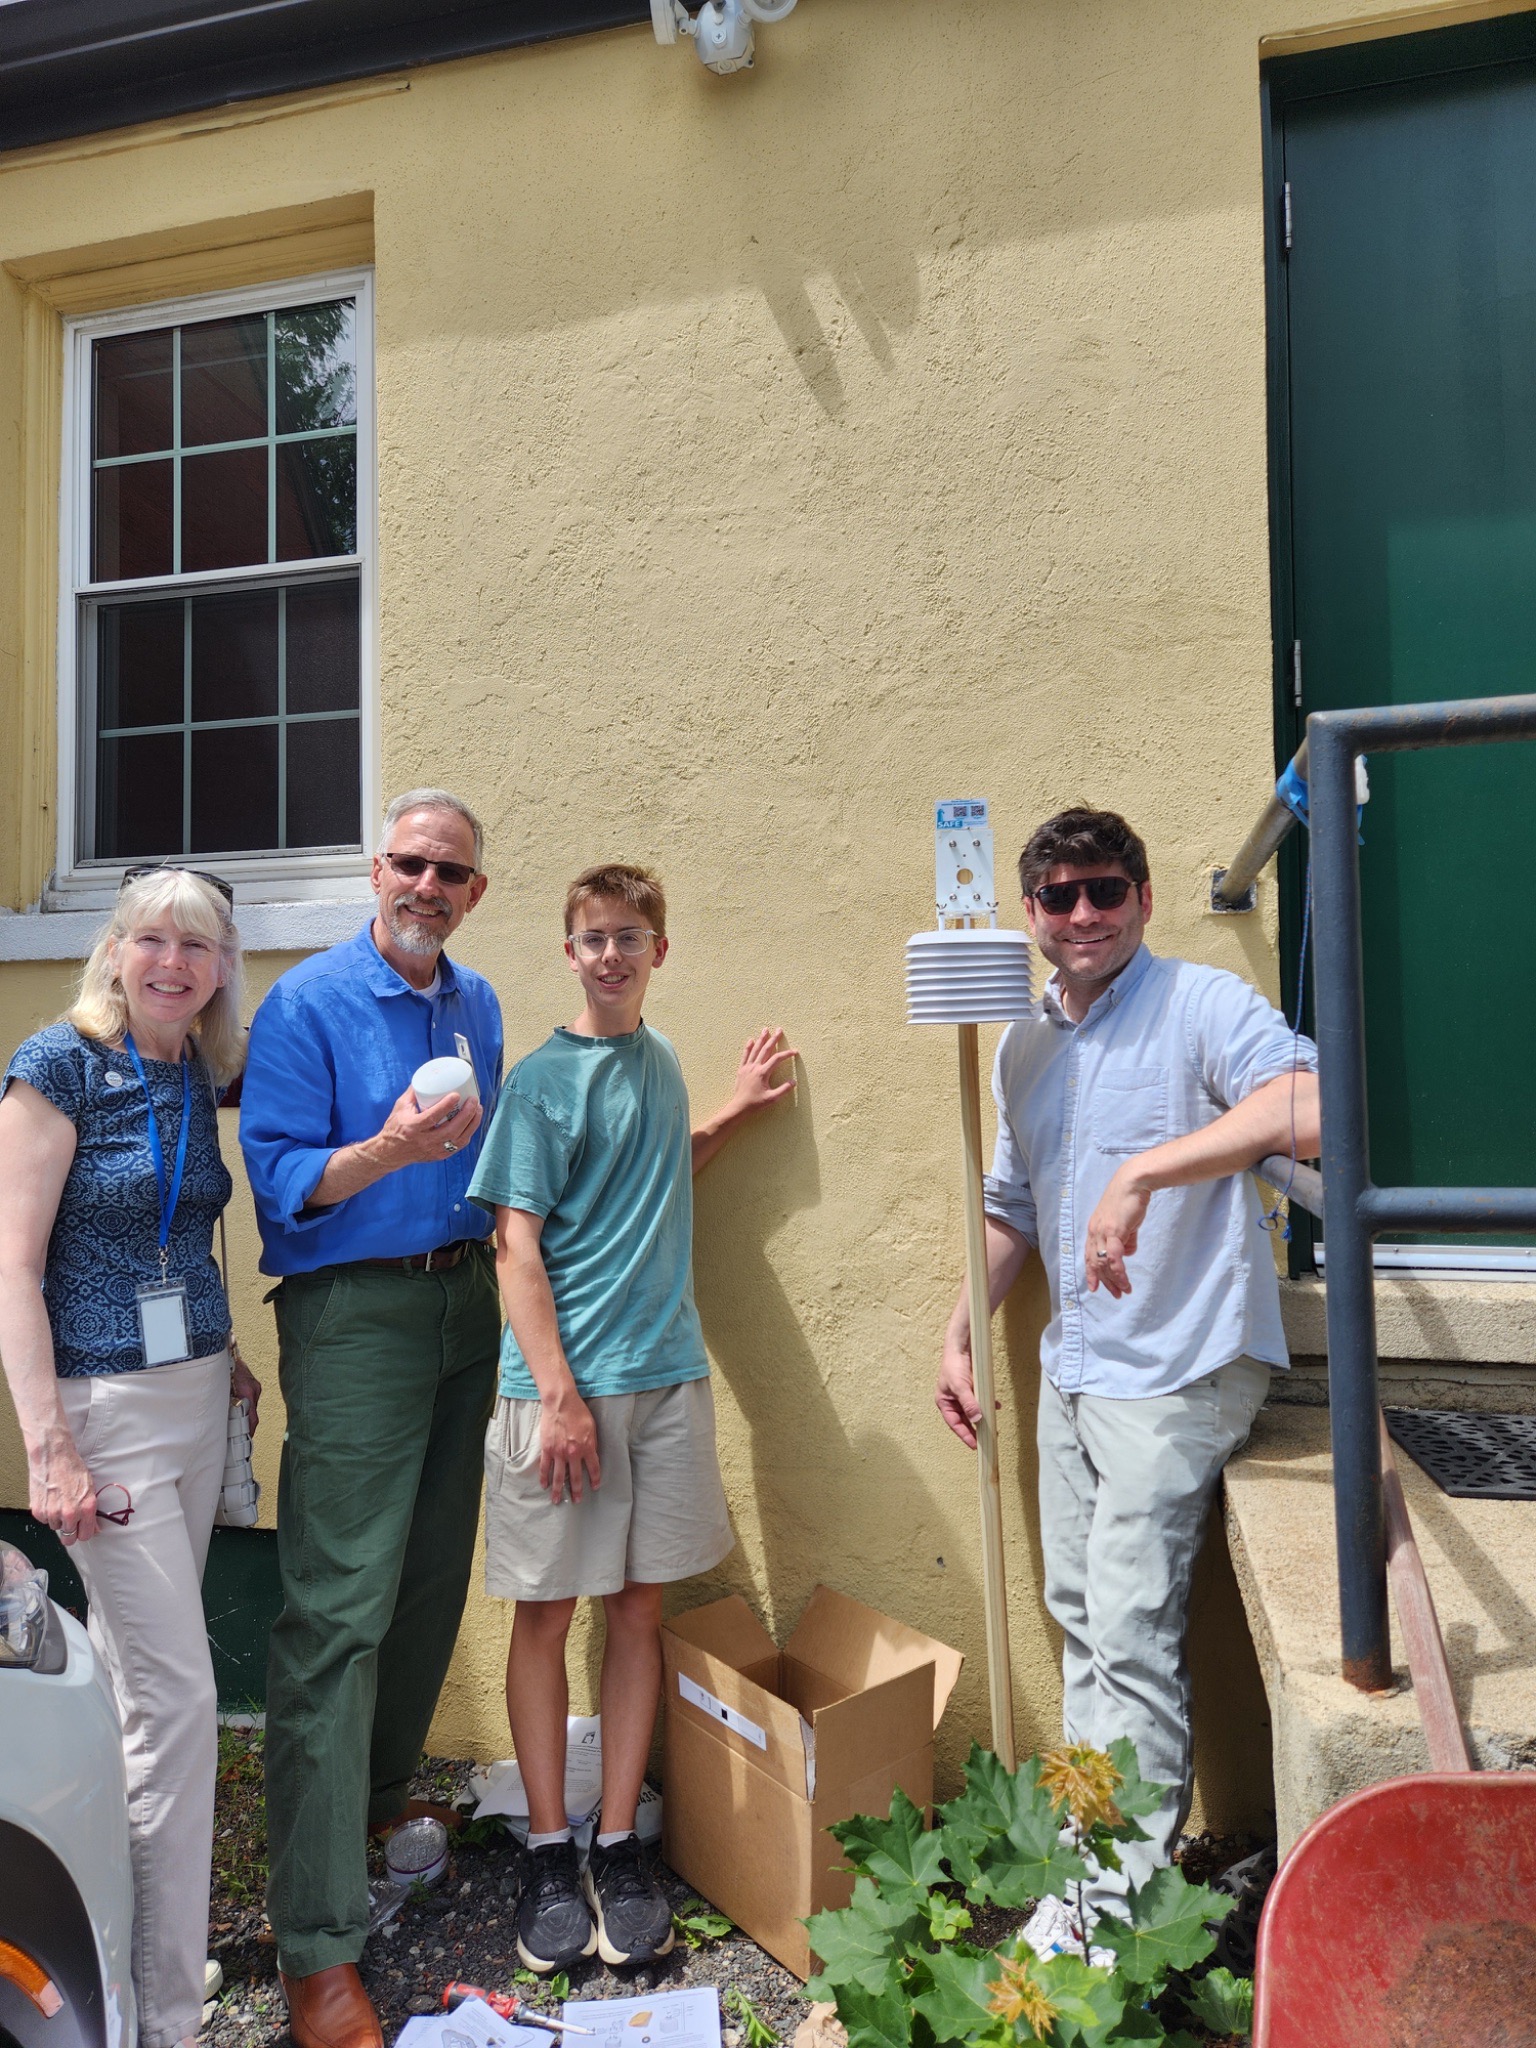
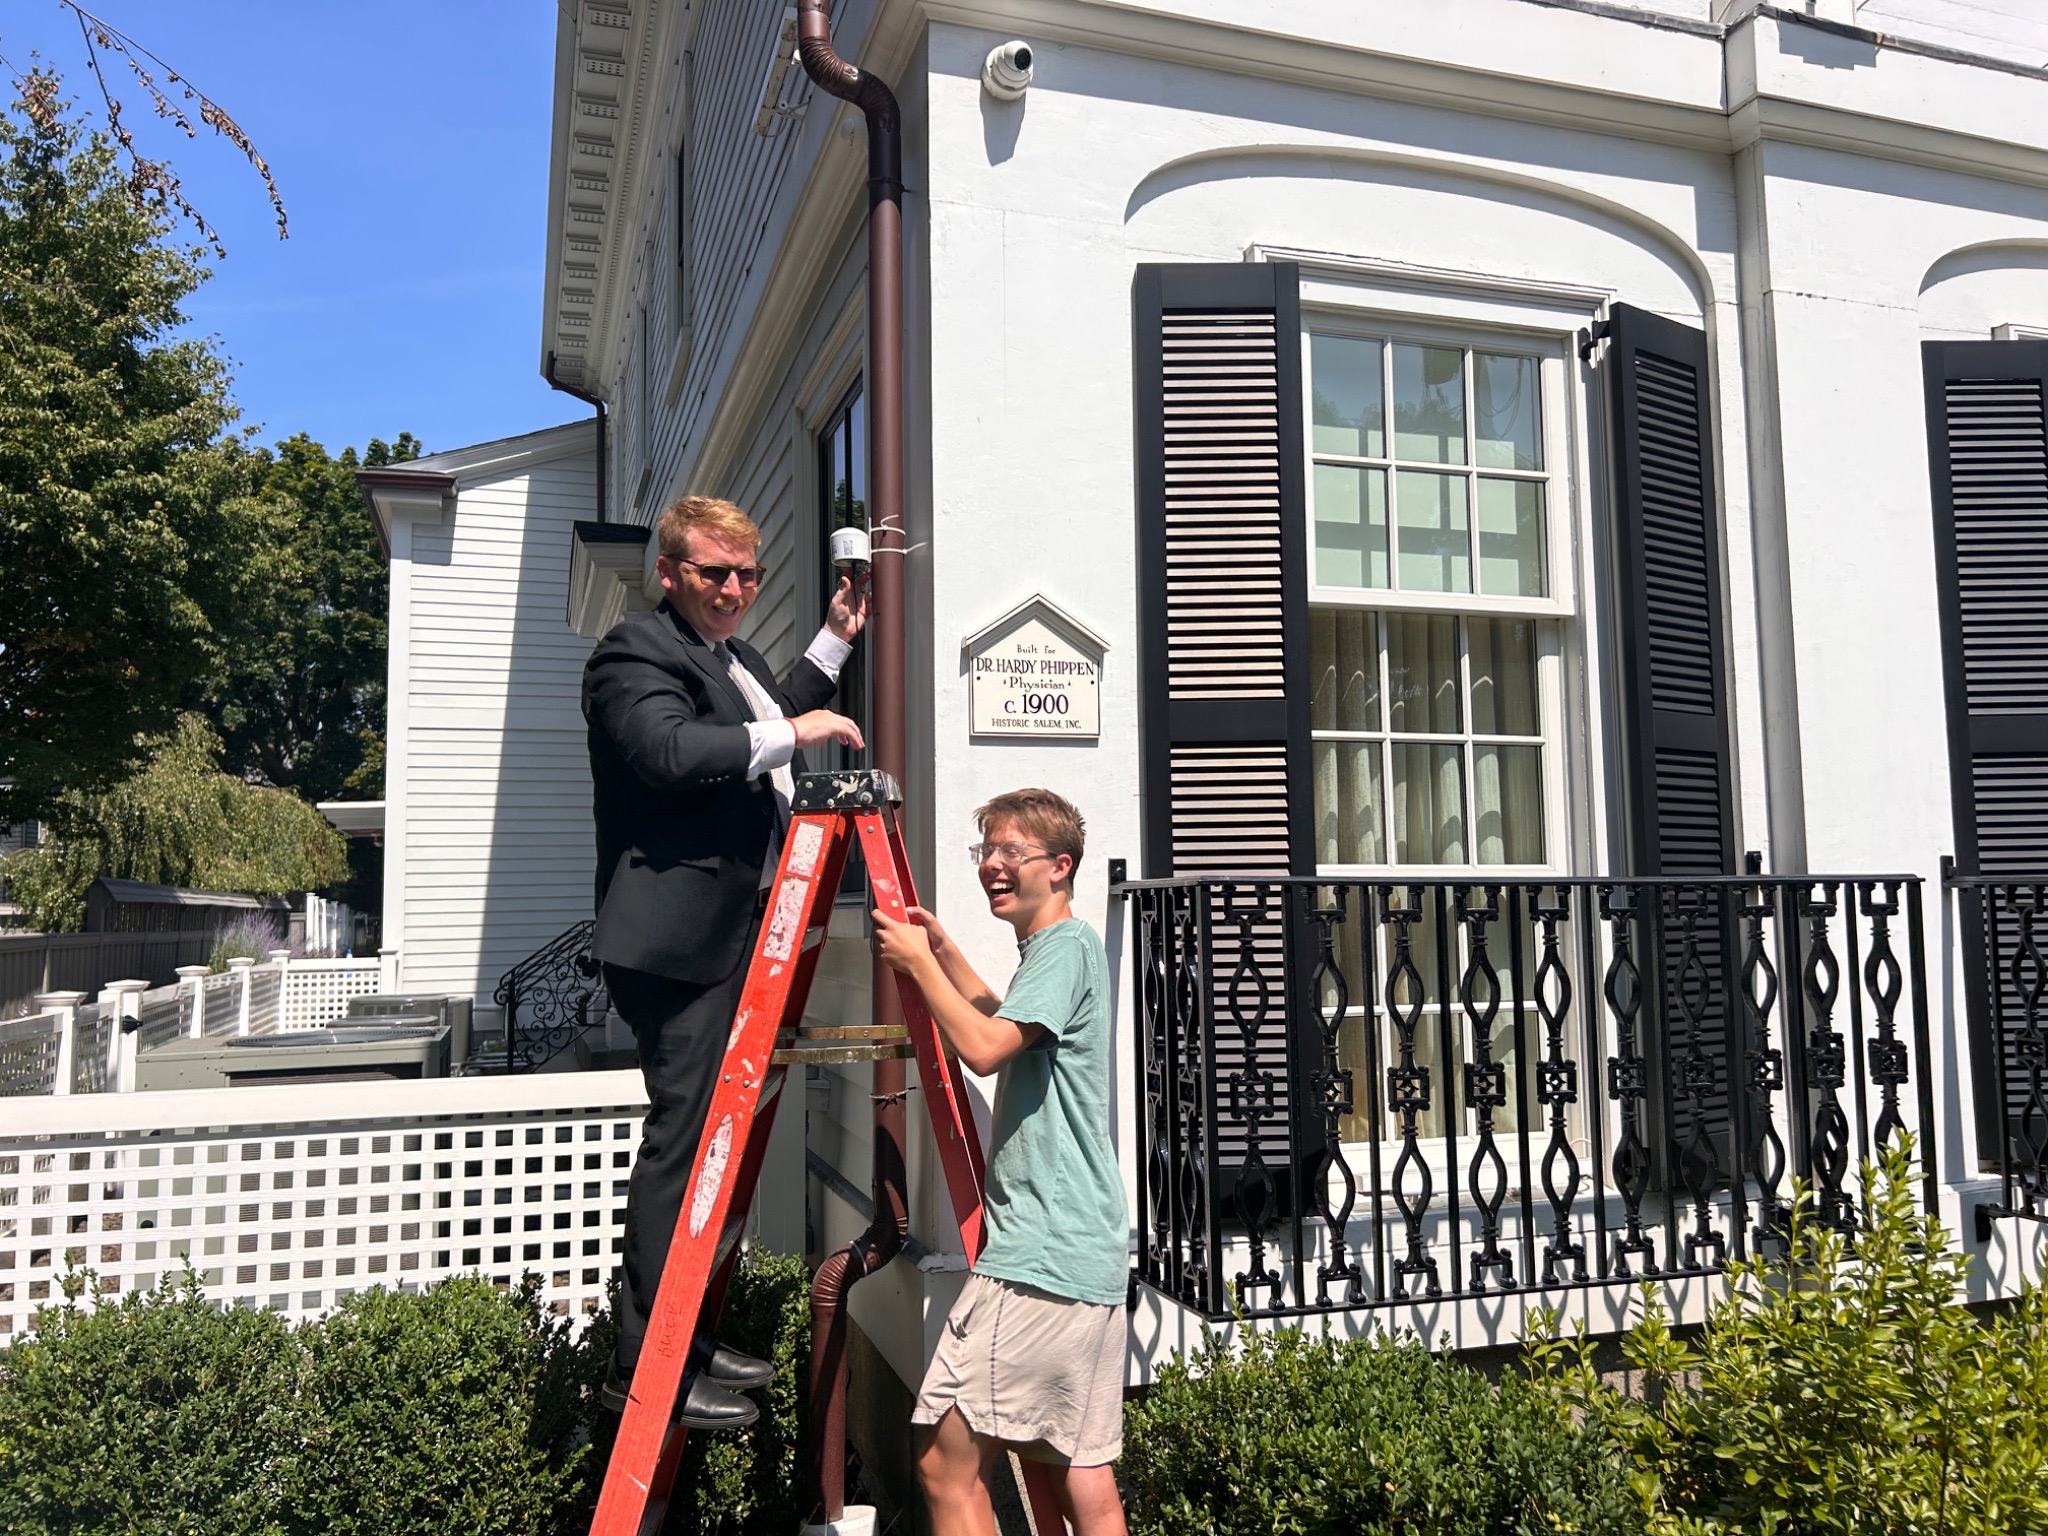


How to Read the Data
PurpleAir monitors use an index and color scale to display air quality levels. These are likely the same standards that your weather app uses when displaying the current air quality. Check your nearest sensor remotely at the Purple Air Map.

Sources and Acknowledgements
SAFE would like to extend a huge thank you to the businesses, organizations, and residents that supported this work. This includes, but is not limited to, the Massachusetts Department of Environmental Protection, the North Shore CDC, O’Donnell Funeral Home, Salem Public Schools, Saint Peter’s/San Pedro Episcopal Church, and Barbara Kelly, a resident and leader in the Historic Derby Street Neighborhood Association who helped to negotiate the Wind Terminal’s Community Benefits Agreement.
Qiu, M., Li, J., Gould, C.F. et al. Wildfire smoke exposure and mortality burden in the USA under climate change. Nature 647, 935–943 (2025). https://doi.org/10.1038/s41586-025-09611-w