
Pagina en Español: Resistencia al Calor
In collaboration with the North Shore Community Development Coalition, the City of Salem, the MAPC, and Salem State, SAFE is supporting a resident-led urban heat resiliency pilot project in El Punto. We educate on the impacts of heat and drive data collection through heat sensors, surveys, and heat mapping. This is a Barr Foundation funded project.

In Salem, we have neighborhoods that experience high heat differently than others due to a lack of green space, higher density, etc. We are working on the pilot project in The Point because it is the most densely populated, high urban heat area in Salem.
This is likely due to densely packed buildings, impervious surfaces (a surface that is densely compacted, such as concrete), and a high quantity of dark-colored roofs (roofs that absorb heat and re-radiate it rather than reflecting it).
In the summer of 2025, SAFE worked with Professor Nickolas Geron from Salem State University (SSU), along with some of his students at the university, to install 2 heat monitors, one on SSU’s campus and the other behind the North Shore CDC’s offices. Below, you can watch their presentations on the data collected and what it means.
Explanation of the High Heat Project from the City of Salem
High heat is an environmental justice issue.
Historically redlined districts (Areas that were systematically prevented from building wealth on the basis of race) are on average 5°F hotter than other districts. These neighborhoods are primarily occupied by people of color, putting them at a higher risk of experiencing disproportionate high heat.
Video Explaining Historical Redlining and How It Affects Heat Exposure
Recent Heat Monitor Installations
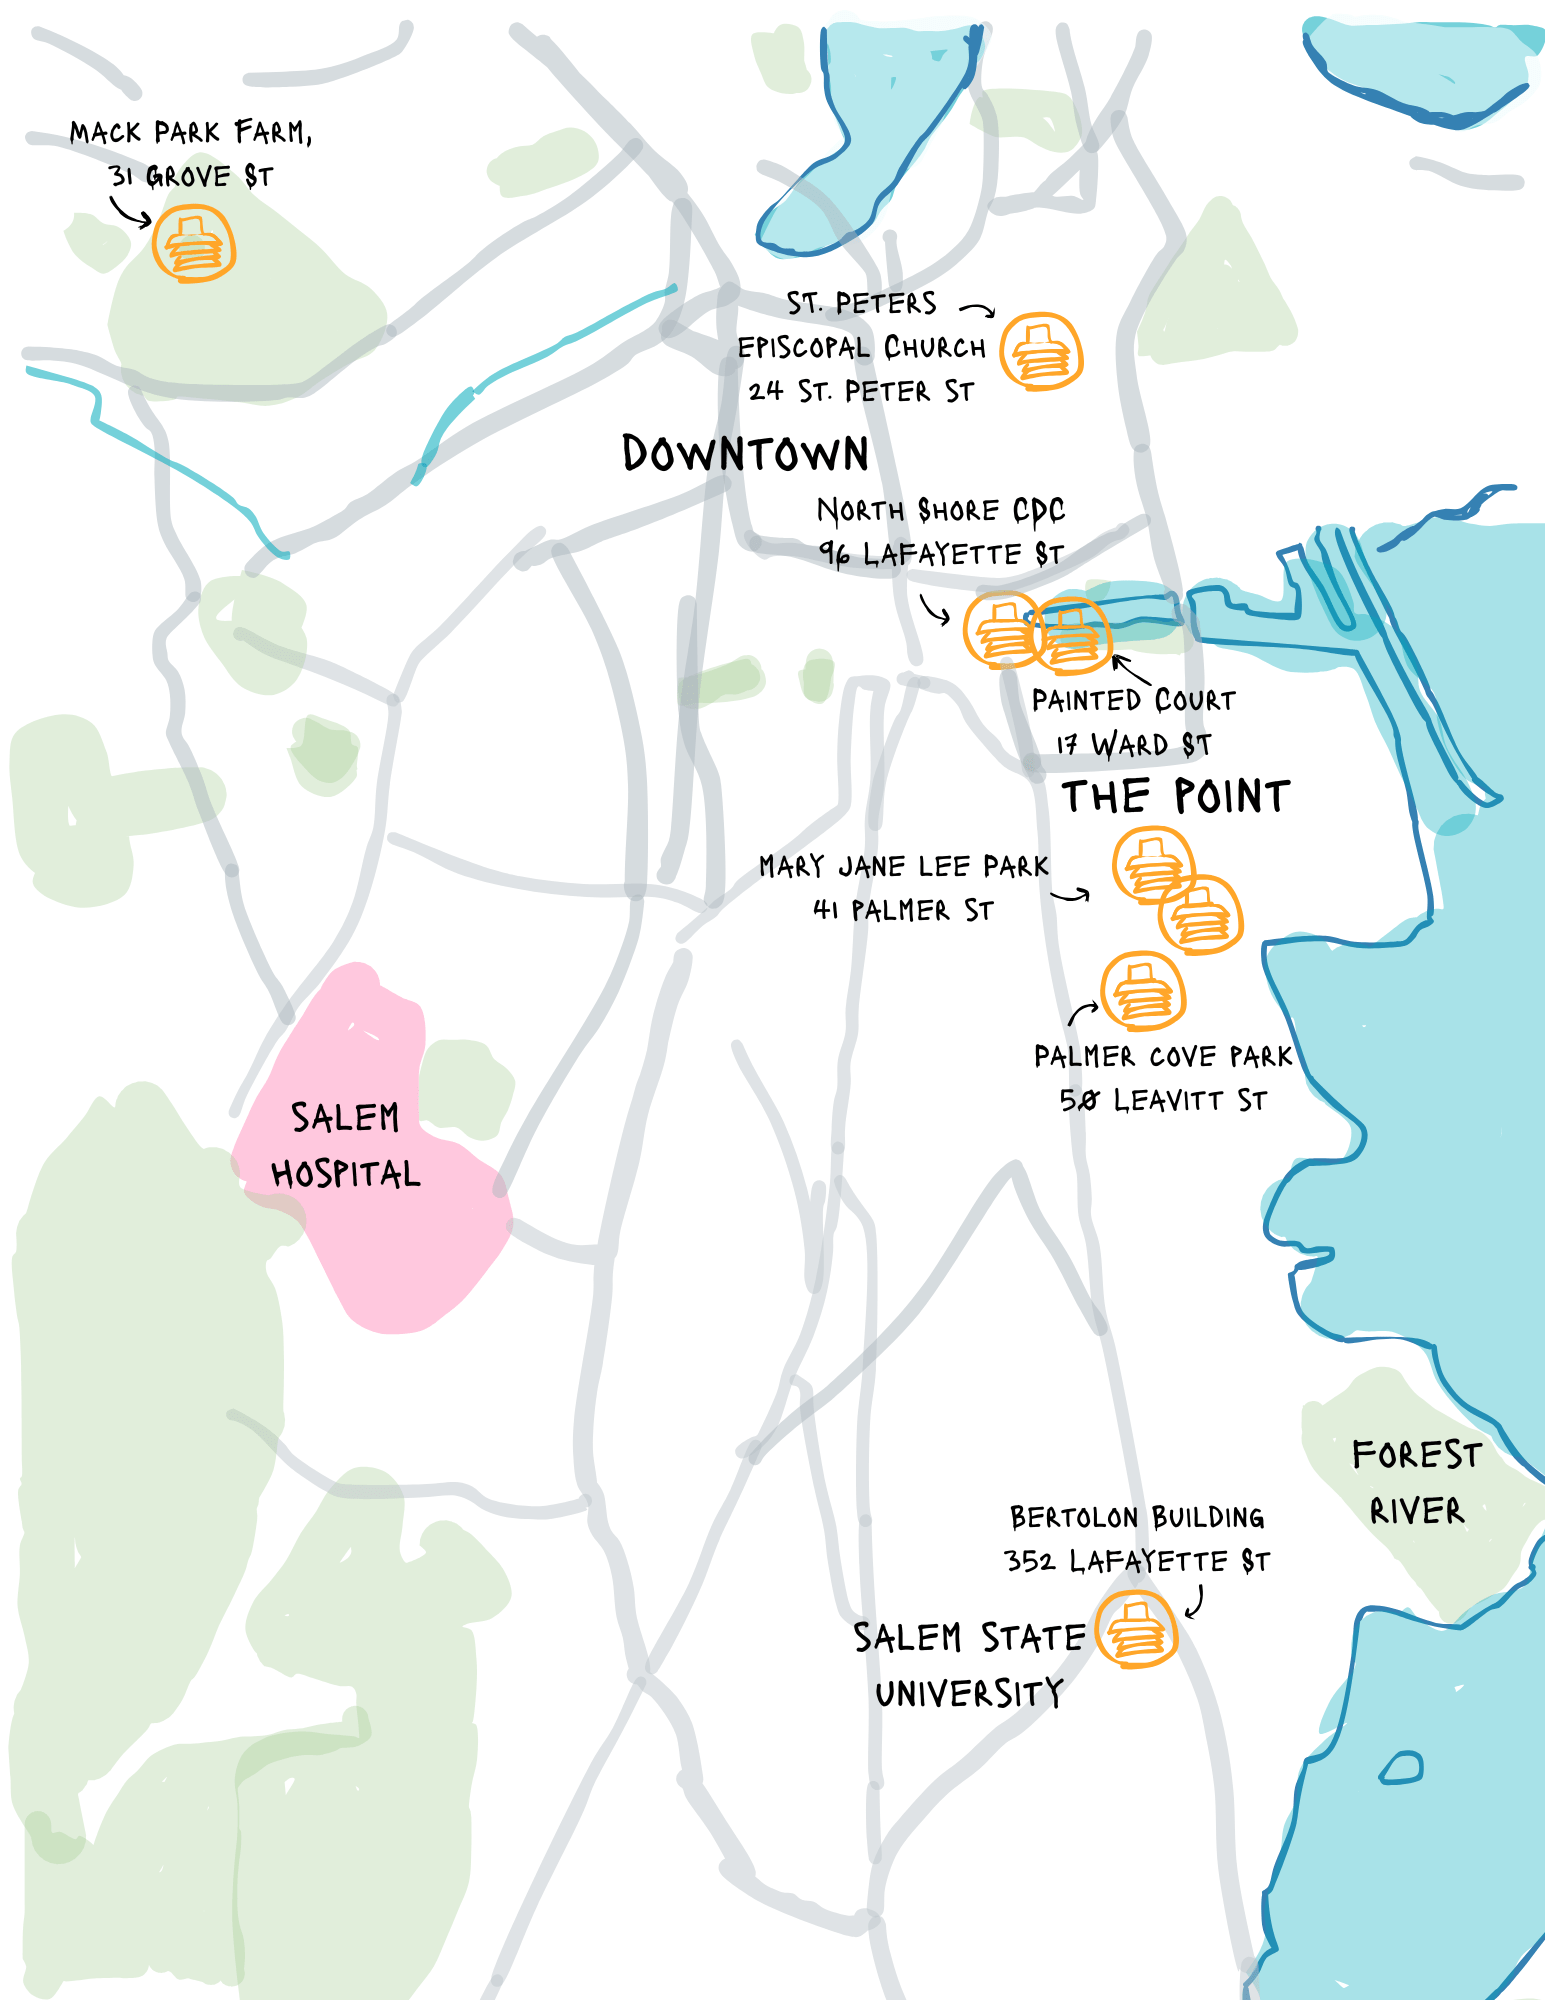
Since we began the project, Salem Alliance for the Environment (SAFE) has installed 6 heat monitors in The Point. One is behind the North Shore CDC at 96 Lafayette St, two are nearby Mary Jane Lee Park, another is on a pole in Palmer Cove Park, and the last is at the painted basketball court on Ward St.
Below are some helpful infographics detailing how to access the data from your local heat monitor.


Actions to Take and Risk Factors for High Heat Events
As we’ve learned over the weekend of July 4, extreme heat events can extremely be dangerous for health. The graphics below details who is most affected by high heat, and offers tips for how to stay cool during the summer.


Interested in learning more about high heat?



Leave a Reply